

An EBITDA multiple is a valuation metric used to estimate what a business is worth by multiplying its EBITDA (earnings before interest, taxes, depreciation, and amortization) by a market-based factor that reflects growth, risk, profitability, and buyer demand. In simple terms, it shows how many times a company’s annual operating earnings buyers are willing to pay.
The average EBITDA multiples climbed to approximately 10.1× in 2025, up from 8.8× in 2022, reflecting stronger deal activity and rising buyer confidence in the M&A market.
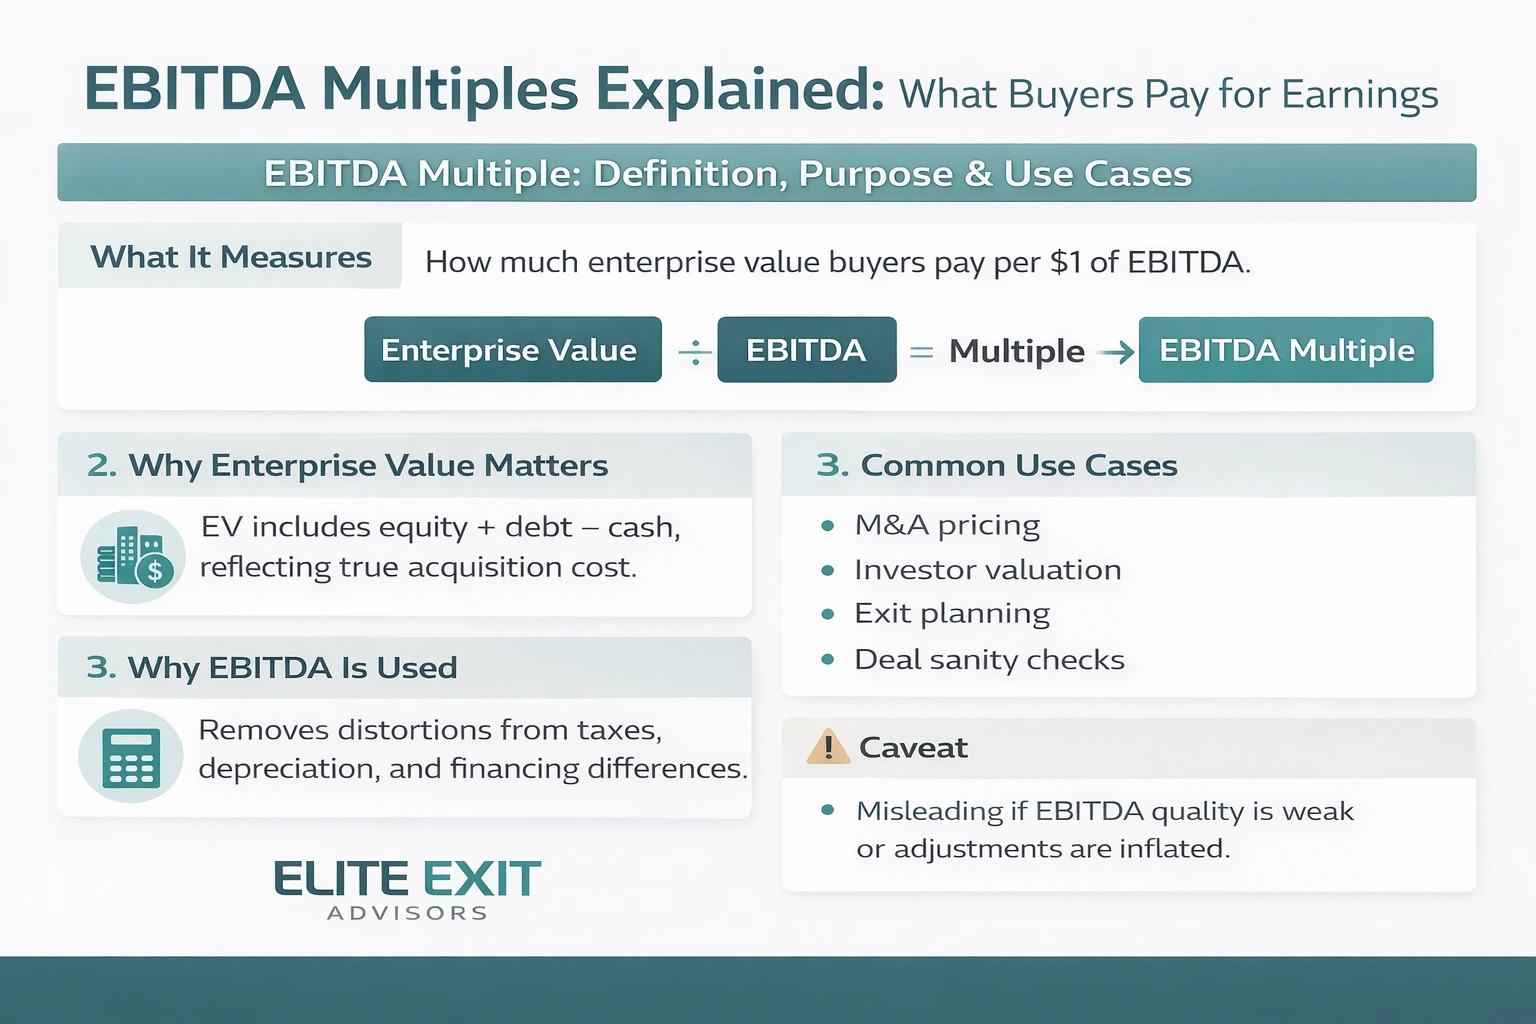
This valuation ratio shows how much total firm value the market assigns for each dollar of operating profit before financing and accounting items. It normalizes differences across companies so analysts can compare like-for-like performance and value.
The ratio expresses how many dollars of enterprise value a buyer or investor pays per dollar of operating earnings. It converts operating profit into a simple price signal that supports quick valuation comparisons.
Enterprise value combines equity value and net debt, so it accounts for different capital structures. Buyers typically assume or refinance debt when they acquire a company, so enterprise value gives a truer picture than equity alone.
Differences in taxes, depreciation, and fixed assets can distort net income. That is why using operating earnings as a proxy helps level the field across firms with varied accounting policies.
Practitioners use this ratio for M&A screening, investment committee memos, lender discussions, exit pricing guidance, and sanity-checking an offer price. It is a fast tool for valuation and initial deal assessment.
When it’s less useful: the metric can mislead if cash-flow quality is poor or adjustments are aggressive.
This metric isolates operating profit and strips away financing costs and accounting allocations that do not reflect day-to-day operations. It reflects operating performance before interest, income taxes, and non-cash expenses such as depreciation and amortization.
Calculated from the bottom up, the figure starts with net income and adds back taxes, earnings interest, and depreciation amortization. The result highlights core operating drivers like revenue and cash operating expenses.
It excludes financing effects, tax policy, and non-cash items that can vary across firms. That exclusion is deliberate so analysts can compare operating results across different capital structures.
Depreciation and amortization reduce reported profitability but often don't change near-term cash flow. For that reason, analysts use this measure to compare companies whose accounting for assets differs.
Reported values come straight from statements; adjusted figures remove one-time or non-recurring items and other normalization adjustments. Common adjustment categories include restructuring, non-operating gains, and owner compensation normalization.
Only when the same definition is used across firms and periods does the ratio work well as a valuation signal.
Enterprise value shows the total economic claim on a business by all providers of capital. It is the figure buyers use to assess the true cost to acquire operations, not just the payout to equity holders.
Equity value equals what shareholders hold after listing shares or closing a deal. In contrast, enterprise value reflects what a buyer effectively pays for the operating company before normal deal adjustments.
Buyers focus on enterprise value because they assume or refinance outstanding debt and benefit from any cash on the balance sheet. That makes EV a closer proxy for takeover economics than equity alone.
Accurate enterprise value inputs matter as much as getting operating profit right..
Valuation starts with a clean formula that divides total firm value by operating earnings to produce a compact price metric. Below are the calculation steps, definitions, and a worked example you can follow.
Formula: Enterprise Value / EBITDA. Enterprise value equals (market cap + debt + minority interest + preferred shares) minus cash and cash equivalents. Each input should match the same date as the earnings period.
Start with market capitalization, add gross debt and other claims, then subtract cash. Include preferred equity and minority claims when present to reflect total buyer obligations.
Begin with net income and add back taxes, interest expense, and depreciation & amortization to reach operating cash profit. Make only justified adjustments for one-offs and owner compensation.
Always align EV date with the earnings period. Comparing a current EV to forward projected earnings is valid, but note forward figures can lower the stated ratio if growth raises projected earnings.
The same EV yields a lower ratio when projected earnings rise. That shows why forward measures often look cheaper when growth is expected, even if price stays fixed.
Practical tip: Always verify inputs and period alignment before reporting a valuation ratio.
A headline price tells you little unless you compare it to similar companies and the health of underlying cash flows. Use the ratio as a directional signal, then dig into the drivers that explain why a quoted value sits where it does.
High readings often signal strong growth expectations, durable margins, or scarce supply in a hot market. But high can also reflect over-optimism if forecasts are fragile.
Low readings may point to undervaluation, weak profitability, or higher risk. Context matters: compare to peers before labeling a low figure as a bargain.
Public company averages tend to sit higher, around 8x in many industries, since size, liquidity, and transparency support higher prices. Private firms often trade nearer to 4x, reflecting smaller scale and higher execution risk.
Capital intensity, recurring revenue, customer concentration, and cyclicality change how investors price earnings. Subscription businesses often earn premium pricing versus commodity, cyclical industries.
Key drivers are growth rate, margin profile, durability of earnings, and the quality of cash flow conversion. Strong, predictable cash flows usually justify higher valuation. Weak or volatile flows compress the price.
Start with true comparables, then adjust for differences in scale, growth, and risk before drawing value conclusions.
Use peer sets first, then modify expectations for business model differences and specific risk factors like key-person dependence or working capital swings. Remember: this metric is a starting point, not a substitute for thorough cash-flow analysis.
.webp)
Choose the ratio that answers your valuation question: is the goal to price the company or to measure return on that price? Different metrics frame those views.
EV/EBITDA frames value per dollar of operating profit. It helps buyers see what they pay for earnings in price terms.
EBITDA/EV is the inverse. It reads like an earnings yield or ROI on enterprise value. Higher values suggest stronger operating profitability versus price and work well for within-industry comparisons.
Use earnings-based ratios for stable, profitable firms with consistent EBITDA margins. They reflect cash-generation quality.
Revenue ratios suit high-growth or unprofitable companies where earnings are weak or volatile. Market participants often switch emphasis when growth exceeds the next rule of thumb.
As a practical rule, investors lean toward revenue-focused valuation once annual growth is roughly 20–30% or higher.
In software and tech, apply the Rule of 40: revenue growth rate plus EBITDA margin should exceed 40% to justify premium pricing.
When a company goes to market, buyers use EBITDA multiples to estimate an initial valuation range, then stress-test the earnings behind the number. The multiple only holds if EBITDA is repeatable, defensible, and supported by real cash flow, not accounting optics.
Buyers typically focus on:
A strong multiple means little if buyers don’t trust the earnings quality.
Before applying a multiple, buyers validate the durability and risk profile of earnings.
They analyze:
They also model capital structure impacts:
Enterprise value is just the headline, equity value depends on what remains after debt and working capital adjustments.
Multiples often appear stronger than reality due to inflated or poorly supported EBITDA.
Common issues include:
These red flags weaken credibility during diligence and often lead buyers to:
Elite Exit Advisors translates valuation theory into a practical exit plan that buyers can underwrite with confidence. We help businesses tighten reporting and tell the right value company story.
Book a call to review your financials and build a sale-ready plan that links earnings quality to price.
A compact valuation ratio turns enterprise claims into a single price signal tied to operating performance. The EBITDA multiple links enterprise value to core operating earnings so analysts can compare one company to another quickly.
Two inputs matter most: a correctly built enterprise value and a consistent, well-supported ebitda figure (reported or adjusted). Match the EV date to the same period of earnings, historical versus forward comparisons change the result.
Interpret high or low readings against industry comparables, growth expectations, risk, and cash-flow quality. Use EV/EBITDA alongside revenue metrics and cash-flow diligence; treat it as a starting point, not the final valuation answer.
