
EBITDA (Earnings Before Interest, Taxes, Depreciation, and Amortization) measures a company’s operating profitability by stripping out interest, taxes, and non‑cash charges so analysts can see how much a business earns from its core activities alone. A good EBITDA looks like it is industry-specific, but benchmarks offer useful context. For example, as of 2025, the average EBITDA margin for service providers in the U.S. is around 9.8%.
Net income, on the other hand, is the bottom‑line profit after subtracting all expenses, including interest, taxes, depreciation, and amortization, from revenue.
Because EBITDA excludes these real costs, it will almost always be higher than net income, which is why EBITDA figures are commonly highlighted by CFOs when focusing on operational performance.
Different metrics tell different stories about a business. One metric focuses on day-to-day performance. The other captures the full economic result for a period. Both matter for owners, buyers, and advisors like Elite Exit Advisors.
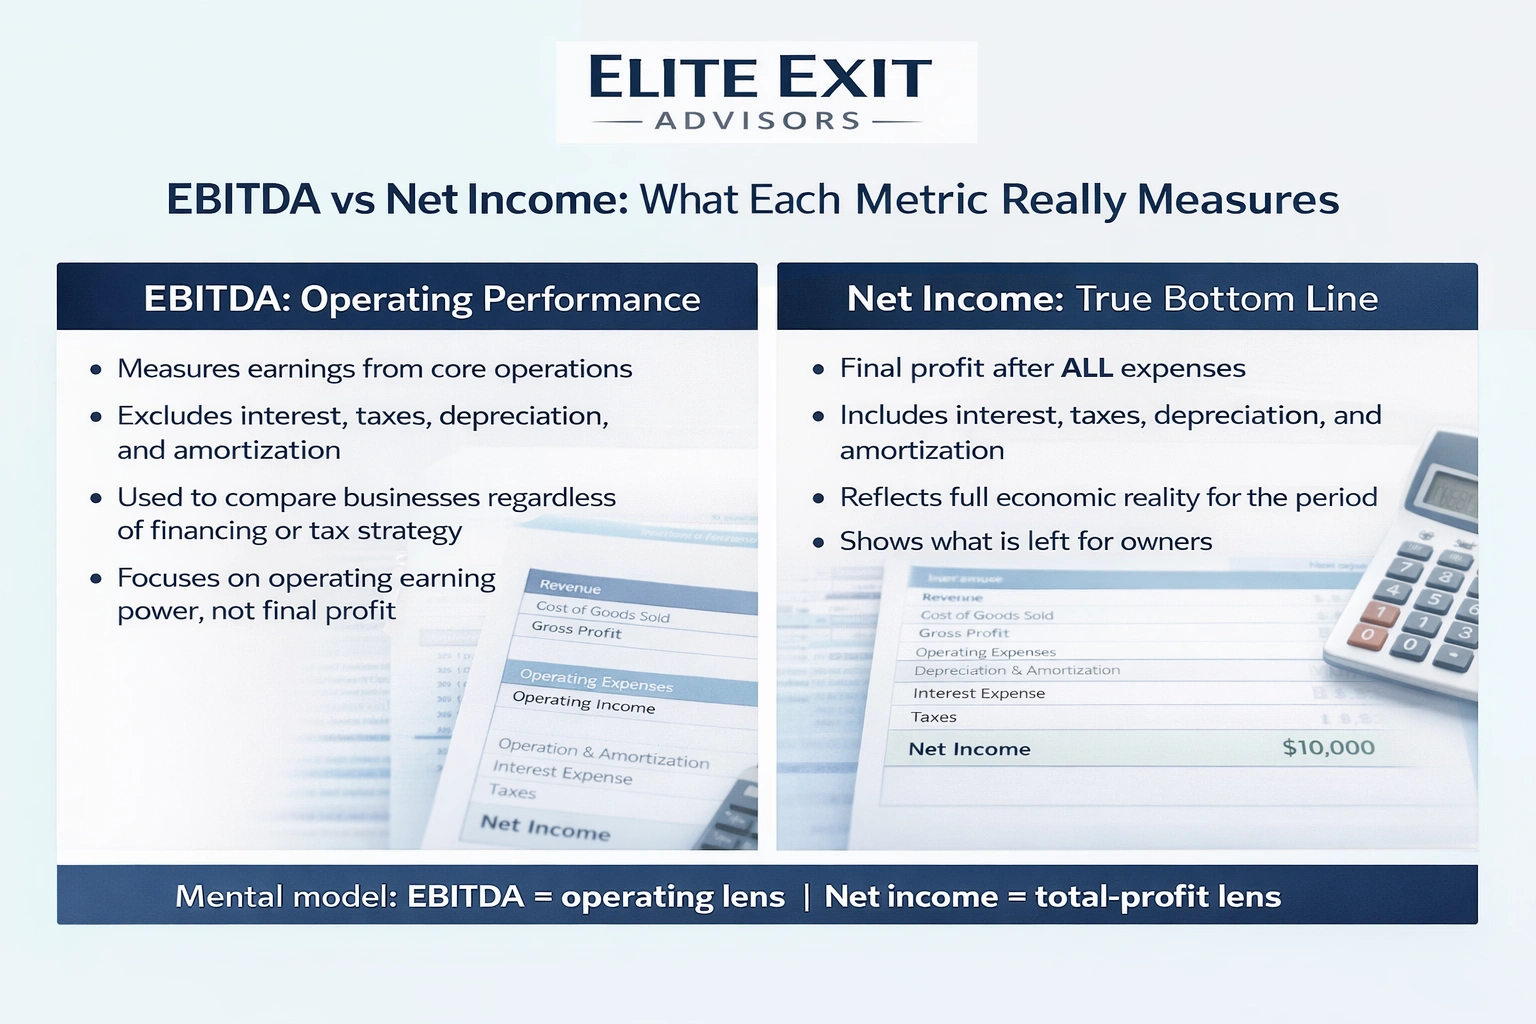
This measure strips out interest, taxes, depreciation, and amortization to show operating earnings. Owners use it to compare the core business regardless of financing or tax strategy.
Because it removes non-operating items, it often acts as a proxy for operating earning power. It is not a GAAP metric and can be adjusted, so definitions and reconciliations matter when you compare companies.
Net income counts every expense and is the final profit after all costs. It reflects the full company financial result and the period’s economic reality.
Non-cash expenses like depreciation and amortization can lower reported profit even when cash flow from operations is strong. Interest and taxes further separate two firms with similar operating results.
Mental model: EBITDA = operating lens; net income = total-profit lens.
Knowing where these figures live on formal reports makes analysis faster and more reliable. Start at the income statement and follow the line items into the cash flow statement to see how accounting results turn into cash movement.
On the income statement, net income appears as the final line. It may be labeled net earnings or net profit. This is the company’s reported result after all expenses.
That final figure then carries into the cash flow statement as the opening amount for cash from operations. From there, accountants add back non-cash items and adjust for working capital to show true cash flow.
EBITDA rarely appears as a GAAP line, so most companies derive it from the income statement. Firms either start with operating income or with net income and add back interest, taxes, depreciation, and amortization.
Because it can be constructed in different ways, owners should document assumptions and reconcile each add-back to the financial statements to maintain credibility with lenders or buyers.
Map the formula to your statement so you can see each add-back in practice. Use a short bridge schedule that begins with reported earnings and then adds back financing charges, taxes, and non-cash charges. This makes the metric auditable for buyers and lenders.
Core formula: earnings + interest + taxes + depreciation + amortization. In most cases, "earnings" means the final reported profit on the income statement.
Common interest-related items include loans, mortgages, lines of credit, convertible debt, and bonds. Add the interest expense line to remove financing effects.
For taxes, use the income tax expense line. Other levies (payroll, property, sales tax) can affect results but the standard add-back is income tax expense.
Depreciation records physical assets losing value. Amortization spreads the cost of intangible assets. Both reduce reported profit but rarely reduce cash that period.
EBIT adds back interest and taxes but keeps depreciation and amortization. Use EBIT for interest-coverage ratios and debt analysis. Use the full add-back when the goal is operating performance comparison.
Adjusted EBITDA removes unusual items like legal settlements, restructuring, or one-off gains. Keep definitions consistent and document each adjustment to avoid misleading comparisons.
Start with the simple math: what a company keeps after every cost is the real measure of profitability. Read this final figure on the income statement; it shows the period’s profit after all charges are recorded.
Formula: revenue minus expenses = net income. This final number reflects every category of expense, from production costs to taxes.
First subtract COGS to get gross profit. COGS includes direct costs to make a product or deliver a service (materials, labor tied to production).
Then subtract operating expenses, sales, marketing, rent, payroll not tied to production, to reach operating income.
After operating income, add or subtract non-operating items like interest expense, one-time gains, or losses on asset sales. These items can skew results if not separated from recurring performance.
Understanding how businesses spread asset costs helps owners read financial statements better. These two accounting entries reduce reported profit while often leaving cash untouched in the reporting period.
Depreciation records how physical equipment and property wear out or become obsolete. Companies spread the cost of a purchase over its useful life so each period bears a fair share of the costs.
Common depreciable assets include vehicles, machinery, computers, and furniture. The depreciation expense flows through the income statement and lowers reported income even though the cash was spent when the asset was bought.
Amortization applies the same idea to intangible items like customer lists or certain IP. A company allocates the purchase cost over the asset’s useful life as an accounting expense.
Both depreciation and amortization are non-cash expenses. That is why analysts add them back when calculating EBITDA to see operating performance. Still, these charges signal future cash needs when assets require replacement, so owners should link them to capex planning.
.webp)
Comparing operating-focused figures to the bottom line helps reveal how financing and taxes shape results.
EBITDA adds back interest, taxes, depreciation, and amortization to reported profit. It removes financing and tax effects plus non-cash expenses so you see operating performance.
Net income includes every expense and is the formal bottom line under GAAP. It reflects interest costs, tax charges, and depreciation or amortization that reduce owner returns.
Because it "adds back" costs that the final profit line subtracts, the operating-focused figure will typically be larger. Non-cash depreciation and amortization are major drivers of the gap.
Debt and tax burdens depress the bottom line but do not change the operating add-backs, so capital structure can create wide differences between the two metrics.
Use the operating measure to compare companies with different financing or tax settings. It improves comparability but can be abused if aggressive adjustments mask recurring costs.
Use the bottom line to judge real profit available to owners after all obligations. It is the standard for reporting and cash planning.
Choosing the right metric depends on your question, comparison, reporting, valuation, or cash planning, and sets up the next section on when to use each measure.
Which measure you use should flow from the business problem you are solving. Match the metric to your goal and avoid optimizing one figure while ignoring the other.
Use EBITDA when you need a clear view of operating performance across companies. It removes financing and tax differences so you can benchmark core business efficiency and scalability.
This metric works well in high-growth sectors and when you compare two acquisition targets on their recurring operating strength. It also helps set bonus plans tied to operational results.
Net income is required for formal accounting and shows total profitability after all costs. Use it to assess dividend capacity, compliance reporting, and actual owner returns.
Track this figure to validate cash planning and to ensure strong operating performance translates into real profit after debt and taxes.
Final note: Use clear, repeatable definitions and track both metrics so your company makes operational gains that also improve owner profit.
Understanding how operating profit, reported profit, and cash movement link helps owners read financial statements more clearly.
Operating income (operating profit) shows profit from core operations after cost of goods and operating expenses. It sits above interest and taxes on the statement and acts as a bridge between gross profit and the final result.
Once interest and taxes are applied, reported profit can fall sharply. Highly leveraged companies often show big gaps because interest charges reduce the final number even when operating results look strong.
The operating metric is not cash flow. It ignores working-capital swings such as receivables, payables, and inventory. It also does not subtract capital expenditures needed to maintain assets.
On the cash flow statement, reported profit starts the operating section. Accountants add back non-cash items (including depreciation and amortization) and then adjust for working-capital changes to get operating cash flow.
A buyer’s offer usually begins when operating results are translated into an enterprise figure. That figure guides initial price discussions and shapes due diligence priorities.
Buyers use operating metrics because they show recurring earning power. Multiples help compare companies that have different tax rates or capital structures.
A buyer may apply an EBITDA multiple to forecast enterprise value, then adjust for debt and cash to reach an equity value that defines the offer range.
EV:EBITDA Ratio = Enterprise Value ÷ EBITDA. A higher ratio can signal higher expected growth or lower perceived risk. A lower ratio may reflect slower growth or higher leverage.
Enterprise value is commonly calculated as market capitalization + debt − cash and cash equivalents. Leverage and liquidity directly affect how buyers price a company.
Sellers prefer adjusted figures that remove one-time costs to show recurring performance. Buyers push back and require documentation for each add-back.
Robust support for adjustments preserves credibility and may improve the multiple a company can command.
Example trend: EBITDA rises from $500,000 to $600,000 to $700,000. That steady growth suggests improving margins and operational efficiency.
Buyers see this pattern as lower execution risk and may accept a higher multiple. Still, they will review the bottom line and cash flow for debt service and reinvestment needs.

Elite Exit Advisors turns complex financial metrics into a clear plan that increases company value before a sale. We focus on telling a consistent story across income and cash flow so buyers see predictable performance and less risk.
Clear definitions and repeatable reporting reduce buyer friction. We make your adjustments auditable and tie every add-back to the company financial statements.
If you want a clearer view of where you stand and what to improve next, book a call with Elite Exit Advisors. We will map short-term fixes and medium-term changes that raise valuation and reduce surprises in diligence.
Match the metric to your question: use the operating measure when you want to judge core performance and use the full-profit figure to see what the owner actually keeps. They answer different questions and both matter to value and strategy.
EBITDA removes interest and taxes plus depreciation and amortization to isolate operating performance. net income reflects all expenses and shows the true bottom line.
Always reconcile definitions back to the income statement and cash flow statement. Remember that the operating measure is not the same as cash flow, working capital and reinvestment needs change real cash.
Next step: track both metrics over time, watch the gap between them, and investigate drivers like debt costs, tax shifts, depreciation policy, or one-time items.
