

Rule‑of‑Thumb business valuation is a fast, practical way to estimate a company’s worth by applying simple multiples to key financial metrics like discretionary earnings (SDE), EBITDA/EBIT, or annual revenue. It gives business owners a quick value range for early exit and succession planning without the time or cost of a full appraisal. Roughly 75% of business owners plan to transition or exit their business within the next 10 years, making early valuation benchmarks like these especially useful for setting realistic goals and planning next steps.
Unlike a formal valuation, rule‑of‑thumb methods are not definitive prices but rule‑of‑thumb estimates based on experience‑driven multiples. They help you gauge feasibility, test scenarios, and decide whether deeper analysis makes sense before you enter a live sale process. Using a business valuation for an exit strategy early ensures you understand potential value ranges and can plan effectively for a successful transition.
Many owners start with a simple multiplier tied to a single number to get an early sense of worth. This shorthand applies an experience-based multiple to a selected metric, such as seller cash flow, EBITDA, or annual sales. The output is a quick range, not a final figure, meant for planning rather than closing a deal.
The phrase comes from using a thumb as an informal measuring tool. That image shows why two seemingly similar firms can still land in very different ranges. Small differences in customer concentration, contracts, or management depth can shift price notably.
For a business owner planning retirement or a multi-year succession, a fast estimate helps set timelines and goals. It offers a target range to guide discussions about hiring, cleanups, or growth needed before a sale.
Later sections name the common metrics and show why normalization and comparable transactions matter when you move from a quick estimate to a formal appraisal.

A rough multiple is most useful early in planning when an owner needs a fast, practical check on feasibility. Use it to set goals, sketch timelines, and decide if investing in deeper analysis makes sense.
Early-stage planning: Ideal for goal-setting and understanding what might be possible in the coming years. It helps owners see whether growth or expense work could move the value needle.
Live sale pricing: Risky to rely on a single number when buyers demand proof. At this stage, documentation, comps, and a quality earnings review are essential.
A rough range serves as a gut check: if the number feels off, that flags margin pressure, customer concentration, or owner dependency.
Use the range to decide whether to pay for detailed work and to track progress annually. Document assumptions, metric chosen, time period, add-backs, and multiplier sources, so one figure does not mislead.
Key performance numbers help translate accounting records into a usable estimate for planning.
EBITDA (earnings before interest, taxes, depreciation, and amortization) and EBIT start with operating profit. They remove items that depend on financing, tax choices, or accounting timing.
Adding back depreciation and amortization highlights operating cash flow. That helps compare asset-heavy firms to asset-light ones.
Interest and taxes vary by deal and owner. Metrics "before" those items keep the focus on core performance rather than funding or tax strategy.
Discretionary earnings capture true owner cash return. Seller discretionary adjusts earnings for owner salary, personal perks, and one-time costs.
Common SDE add-backs include owner salary, personal benefits, and nonrecurring expenses. Each add-back needs judgment and documentation.
Revenue or annual sales is the top-line figure. Practitioners often remove sales taxes because they pass through to taxing authorities.
Two firms with identical sales can differ greatly if expenses and margins diverge. That is why metrics beyond sales often produce a clearer picture.
Small owner-operated firms often use SDE multiples to turn owner cash flow into a quick value range.
How SDE is built
SDE starts with reported earnings and then normalizes for owner-related items. Remove above-market owner pay, personal expenses run through the company, and one-time costs to show true operating income.
Up: steady earnings, low customer concentration, documented processes, and transferable staff reduce buyer risk and lift multiples.
Down: volatile earnings, heavy owner dependence, poor records, and shrinking margins push multiples lower.
If normalized SDE is $300,000 and the market multiple sits around 2.0–3.0 for similar firms, the estimated business value range is $600,000 to $900,000.
The lower multiple assumes weaker documentation and owner reliance; the higher assumes consistent income, clean records, and transferable operations.
Tip: Keep a clear add-back schedule so the income story is consistent and defensible when you present value ranges to buyers or advisors.
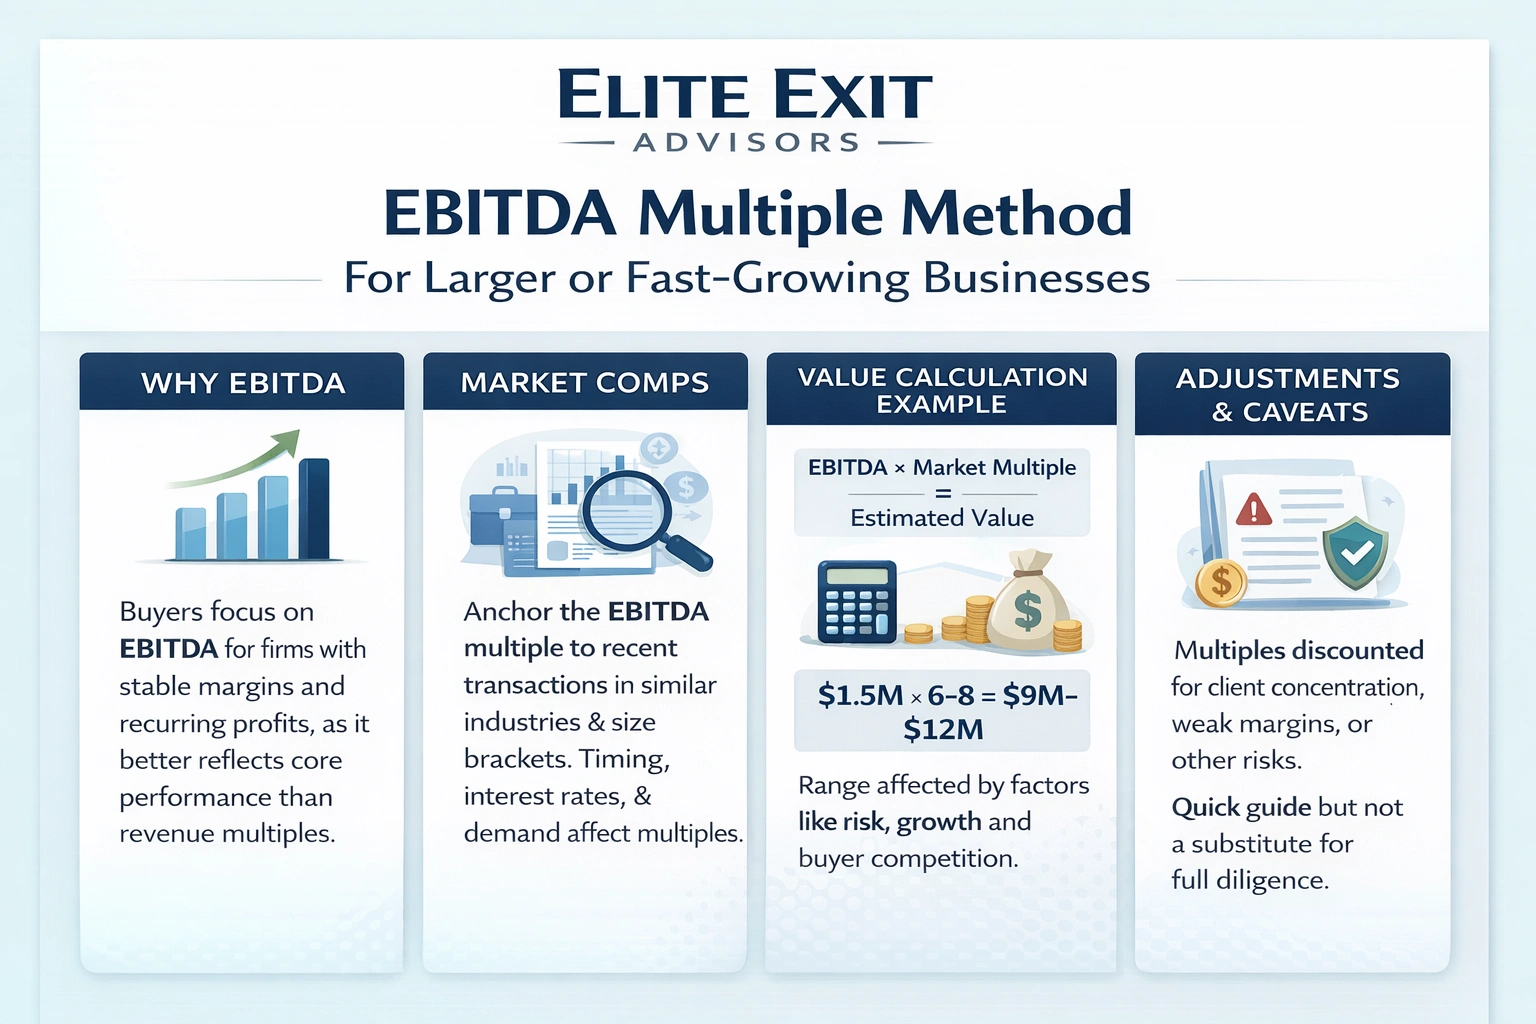
For larger or fast-growth firms, buyers often focus on operating cash flow rather than top-line sales.
Use EBITDA when profitability is established. If margins are stable and recurring, EBITDA better shows core performance than revenue multiples. Revenue can mislead when expenses vary widely across industries.
An ebitda multiple expresses how many times annual EBITDA a buyer will pay. Anchor that number to recent transactions in similar industries and size brackets. Timing matters: interest rates and buyer demand shift available multiples quickly.
Simple math: take EBITDA and apply a market multiple. For example, $1.5M EBITDA × 6–8 = $9M–$12M. The range reflects varying risk, growth, and buyer competition.
A simple percent-of-sales shortcut gives a fast, verifiable starting point when earnings are disputed or unclear.
Sales are often easier to prove than profit figures that need add-backs and judgment. Lenders, buyers, and advisors can trace invoices and bank deposits more readily than subjective adjustments.
Practitioners commonly use a percentage between 30% and 60% of annual sales, depending on industry margins and transferability.
Example math: $2,000,000 in annual sales × 0.35–0.50 = $700,000–$1,000,000. This assumes moderate margins and steady customer demand.
Two firms with identical revenue can have very different cash flow if expenses vary. High operating costs make a revenue-only result misleading.
Sanity-check with margins: if net profit is thin or volatile, reconcile this method with earnings before relying on the number.
Use this as a starting method and reconcile with earnings and deal terms before setting expectations. Treat it as a quick check, not the final answer.
Multiples compress a complex company into one headline number, and that compression hides critical details.
Buyers judge earnings quality, not just the headline figure. Stable cash makes the earnings base believable and supports a higher multiple.
Fast revenue growth with healthy profit margins usually earns a premium. Growth without margin improvement can actually lower perceived value.
Top-line figures can look strong while revenue quality is weak. Heavy reliance on a few clients raises churn risk and cuts how a market perceives future cash.
Document contract terms, renewal rates, and customer diversification so numbers tell the full story.
A firm that operates without its owner is easier to fund and transfer. Strong management team strength and a solid reputation often justify higher pricing.
Conversely, a fragile leadership bench or poor market standing can produce a discount even when earnings look good.
Simple headline prices usually cover operating assets and goodwill, not every ledger item.
Typical exclusions: inventory (unless the offer lists it), real estate, excess cash, and accounts receivable are often carved out. These items sit on the balance sheet and may transfer separately.
Most quick multiples assume the company is delivered free and clear of debt. If a buyer assumes short- or long-term debt, the purchase price is usually reduced dollar-for-dollar to reflect that liability.
Normalized working capital is a common closing adjustment. Work in progress and prepaid sales can trigger post-signing reconciliations that shift net proceeds.
Note: tax treatment and asset vs. stock allocations can change seller proceeds, so include tax counsel as the process moves from a headline number to a final agreement.
Where a company sits in its sector and region can change how buyers value its earnings.
Sector trends shape buyer demand, regulatory burden, and consolidation. Highly consolidated fields often trade at higher multiples because strategic buyers pay for scale.
Crowded markets with intense competition tend to compress margins. Niche leaders with clear differentiation usually sustain stronger pricing and better value.
Location matters. Labor costs, local GDP growth, and buyer pools differ across states and metros.
Regions with deep financing networks and active acquirers move deals faster and can lift achievable multiples.
Buyers reward steady earnings over several years. Erratic performance increases perceived risk and pushes more contingent deal structures like earnouts.
Benchmark against similar firms in your region rather than relying on national averages to set realistic expectations.
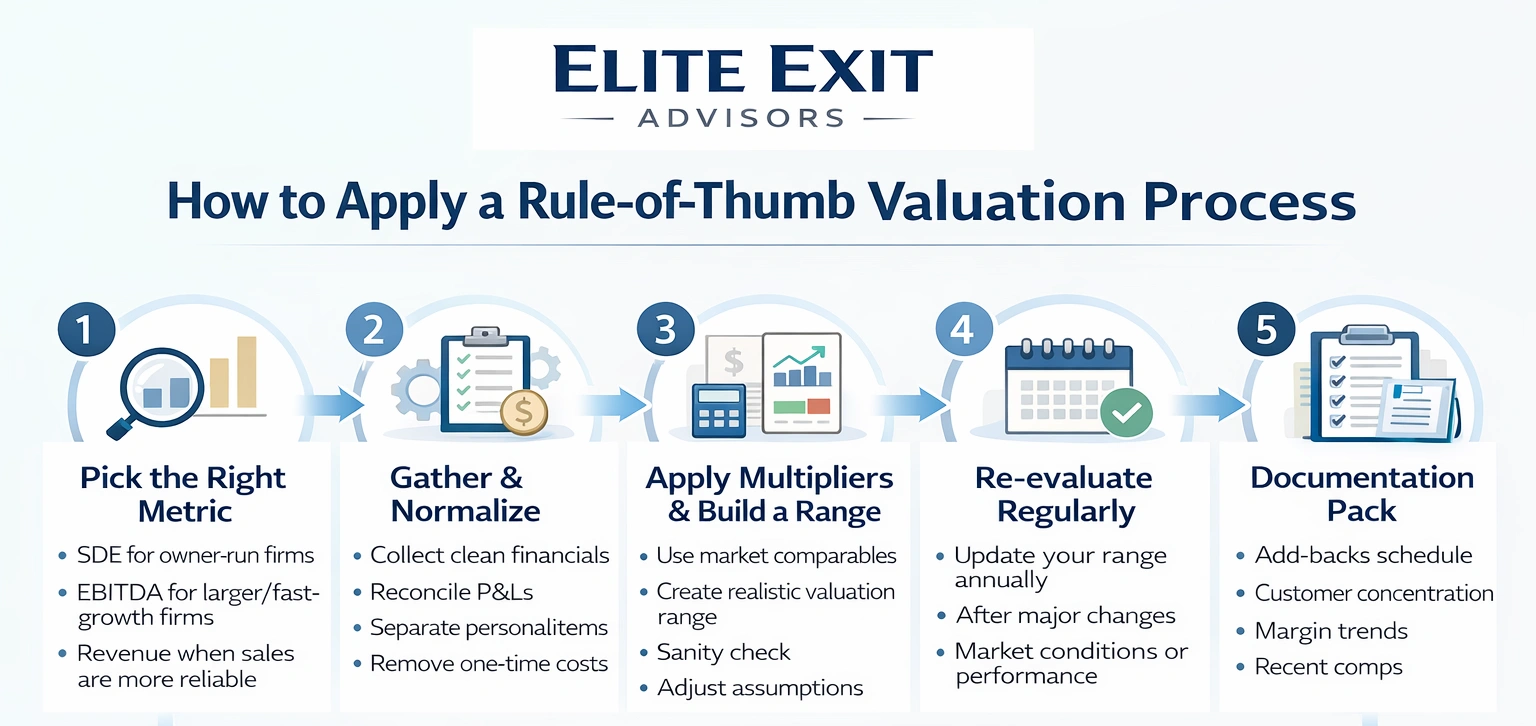
A simple, repeatable process keeps early estimates defensible and actionable. Follow practical steps so each number links to documents you can show a buyer or advisor.
Select the best method based on size and buyer lens: SDE for many owner-run firms, ebitda for larger or fast-growth firms, and revenue when sales are more reliable than earnings.
Collect clean financials, reconcile P&Ls, and document normalization adjustments. Separate personal items and remove one-time costs so expenses reflect ongoing operations.
Use recent market comparables to apply multipliers and create a realistic valuation range rather than a single point. Sanity-check results across metrics, if revenue implies a price earnings cannot support, explain and adjust assumptions.
Update the range as market conditions change, costs rise, and sales shift. Revisit numbers annually or after major events.
Documentation pack: add-backs schedule, customer concentration summary, margin trends, and recent comps.
Quick multiples can mislead when they replace evidence in a negotiation, not just when they simplify analysis.
Understand the real cost of being wrong. Overpricing scares buyers, lengthens time on the market, and weakens negotiating leverage. Underpricing leaves money on the table, especially if the firm has durable growth and low transfer risk.
Overvaluation often creates fewer offers and longer marketing timelines. Buyers probe harder and may walk away when numbers lack support.
Undervaluation means missed proceeds. That loss can be permanent once a sale closes.
Buyers and lenders demand documentation. Unsupported add-backs and arbitrary multiples get challenged and negotiated down.
Historical shortcuts fail when market conditions, technology, labor costs, or regulation change quickly. What worked last year may not fit today’s industry dynamics.
Practical takeaway: Treat any single number as a starting hypothesis. Validate it with comps, normalized financials, and a clear risk narrative so you can defend assumptions in real negotiations.
A quick estimate can highlight gaps between what an owner expects and what an informed buyer will actually pay.
What you get beyond a simple multiple:
At Elite Exit Advisors, we focus on reducing perceived risk so terms improve and closings run smoother.
Services include financial cleanup, documented add-backs, value-driver work, and buyer-ready narratives.

Before you move to a formal process, review this short checklist and then reach out:
Book a call with Elite Exit Advisors to discuss where a quick estimate may be understating or overstating your real market opportunity.
A short, grounded summary helps you move from a quick estimate to a tested action plan.
Use a rule thumb only for early planning, fast benchmarking, and setting improvement targets before a sale process begins.
Remember that a single multiple does not set final value; market shifts and buyer risk views change pricing. Combine SDE or discretionary earnings, an ebitda multiple, and revenue rules to see different perspectives and when each fits.
Avoid common pitfalls: unsupported add-backs, ignoring expenses, and misreading deal items like debt, working capital, inventory, or real estate.
For a reliable path, pair a starting multiple with clean financials, recent comps, and a clear risk-and-growth narrative. Track metrics over years, document assumptions, and update your range as costs, sales, and market conditions shift. Book a call to review next steps.
